Business Intelligence

How does Business Intelligence help us in our business processes?
Nowadays, a business generation process is composed of numerous tools and diverse methodologies that collect a large amount of information, making it very complex to track and obtain data quickly and efficiently. This complexity means that data-driven decision making is delayed in time and form.
Business Intelligence provides us with an analysis of all this information with the aim of facilitating the understanding of this data and rapid decision making.
The usefulness of Business Intelligence (BI)
01
Juan (CFO) needs to monitor the evolution of the company through appropriate KPI's and reports.
02
He has the data in his head, but he doesn't know how to extract it, and he doesn't have the time to do it.
03
Juan is not only looking for a tool, but also for people with knowledge in management control to help him design the solution to his needs.
04
LeftArrow's business process digitisation consultants help define and obtain business-relevant information.
05
Juan has it all in one click.
Save time and gain in data quality.
Recruitment modalities
Starter |
Pro |
Premium | |
|
Implantation* |
6-9 months |
9-12 months |
12-15 months |
|
No. of panels |
4 |
6 |
8 |
|
Orientation |
Analysis of digital uptake. |
Analysis of digital uptake with offline data. |
Comprehensive analysis of the processes related to the company's revenue line. |
|
No. of data sources |
4 |
6 |
8 |
|
Integrable data sources |
CRM |
CRM |
CRM |
How do we treat the data?
Each company generates its own information differently. The combination of tools for general business management is an ecosystem that is practically unique to each company.
This particularity makes it necessary to implement a customised implementation of data capture, processing and visualisation for each organisation.
- Definition of objectives: What final information we want to obtain. General objectives and sub-objectives or milestones that will help us to achieve them.
- Resources: What set of tools, systems and people will be involved in selecting and reading the data.
- Data sources: What selection of data is needed to reach the objectives and sub-objectives.
- Data extraction, cleaning and transformation: Connecting and/or integrating, filtering and modifying data.
- Data modelling: Tables, relationships, measures and hierarchies you propose to use.
- Data visualisation: Which dashboards will be created to easily visualise such data for agile decision making.
- Data analysis: Conclusions, comparisons, segments and patterns.

Where does this data come from?
Several tools are involved in the sales process that generate this data. We can find tools such as:
-
CRM
-
ERP
-
INVOICING
-
LOGISTICS
-
ECOMMERCE
-
WEB ANALYTICS
-
ONLINE ADVERTISING STATISTICS
-
SOCIAL MEDIA STATISTICS
-
USER DATA ANALYSIS
What do we do with the data?

We collect
We read the data at its source and bring it to a platform capable of collecting that data for further processing.

We treat
We apply our Business Intelligence methodology to generate quickly understandable information.

We visualise
We present the data in a dashboard, adapted to the client's needs, to show the most relevant data for quick decision making.
What data can we highlight?
Every company may have different needs, so our solution is able to adapt to the data requirements that you request from us. However, there are some data that will always be interesting for any company.
For example: Segments, Ideal Customer Profile, Purchasing Decision Makers, Customer Acquisition Cost, Customer Lifetime Value, Sectors, Technology, etc.
ARROWBI is a service that provides consultancy support to management personnel through information that has been extracted from its sources and subsequently processed to generate valuable information for decision making in business processes.
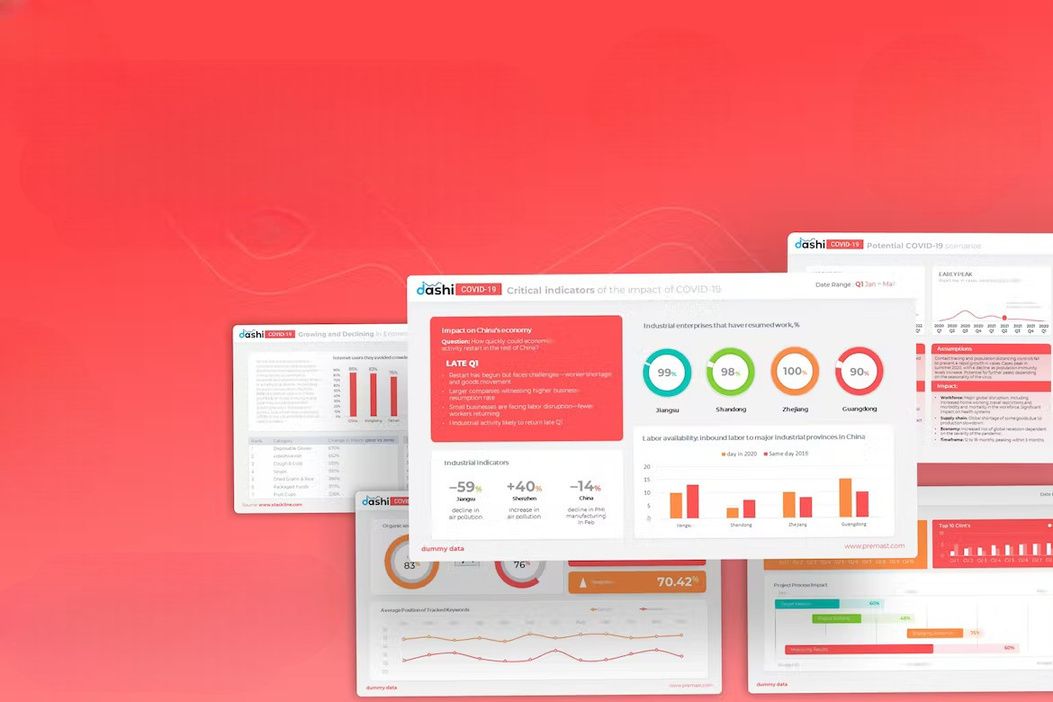
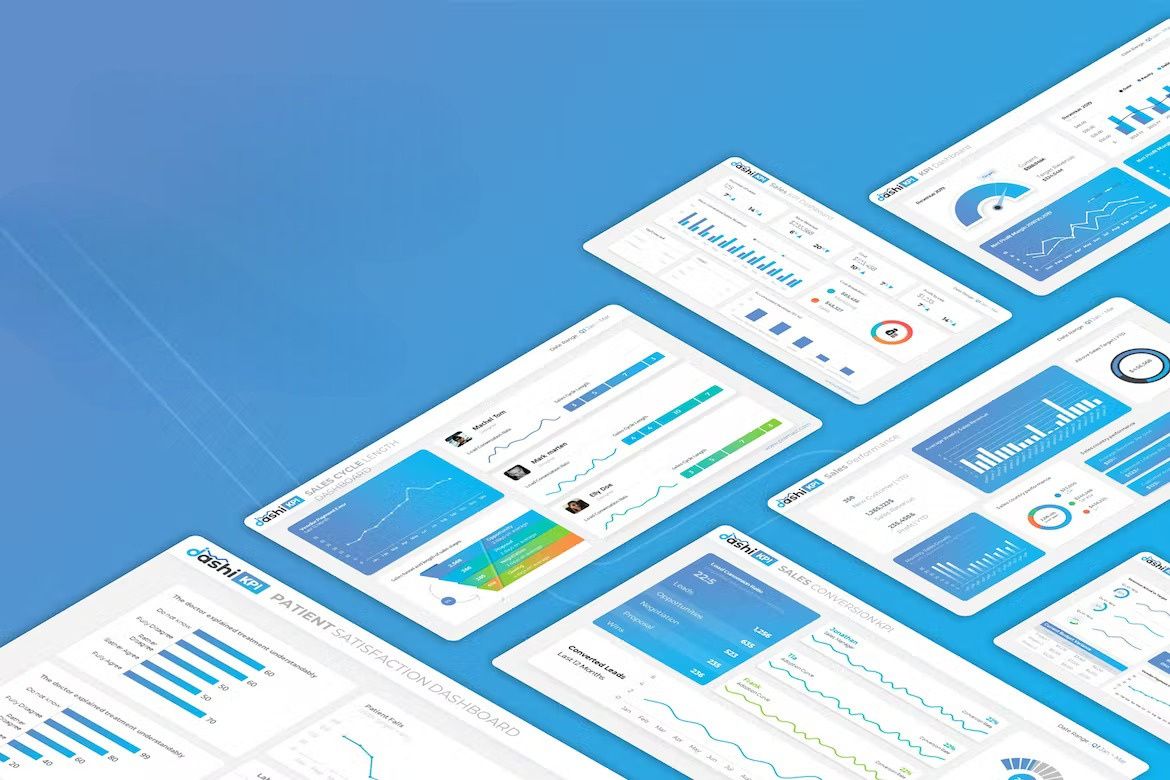
The use of dashboards generated from the defined data sources shows information in a precise way and adapted to the client's needs.

General dashboard
Nowadays, a sales process is made up of various methodologies that compile a large amount of information in such a way that it is impossible to understand this information quickly and efficiently.
Business Intelligence provides us with an analysis of all this information in order to facilitate the understanding of this data.
For example: Sales Process Phases - Management and Commercial Activity - Type of Buyer, Purchasing Process, etc.

General indicators
As in any project, some main indicators will be defined as milestones to be achieved in the attainment of the objective.
When we talk about a company, valid indicators will be defined for sales, as well as customer management variables, service quality, logistics, supply chain etc.
In each area, being able to build SMART, Specific, Measurable, Achievable, Realistic and Time-bound objectives will be the first step for us to analyse whether the path towards achieving them is the right one. Having these dashboards in place will allow the company to iterate and pivot much more quickly.

Sales performance
Taking into account the sales process, the phases of the buying process, segmentation and our Buyer Persona, we can define a cadence of contact, commercial activity, messages and customer management. We generate a standardised sales process to be able to replicate effectively.
These dashboards should reflect where the best results are produced, where the bottlenecks are and which sales tasks are bringing in the most customers and the best financial results.
Productivity, Results of each individual in the sales team, Closures vs. proposals etc.

Lead capture
Taking into account the sales process, the phases of the buying process, segmentation and our Buyer Persona, we can define a cadence of contact, commercial activity, messages and customer management. We generate a standardised sales process to be able to replicate effectively.
These dashboards should reflect where the best results are produced, where the bottlenecks are and which sales tasks are bringing in the most customers and the best financial results.
Productivity, Results of each individual in the sales team, Closures vs. proposals etc.

Custom dashboard
Each organisation will require certain key indicators of its activity, where savings, bottlenecks or improvements can be made.
The Business Intelligence solution allows selective capture of key data for monitoring and improvement, so that management teams can refine information and accelerate decisions.
Tracking and monitoring panels from the previous panels will be combined with others that are specific to the company or sector in which it operates. Stock management, service quality, sales management, economic results, etc. can be examples of this type of panels.
What is the benefit for the company?
The analysis of large amounts of data is a difficult challenge for any company. Currently, the best way to collect, process and analyse this information is by applying Business Intelligence techniques with the aim of making the data of greatest interest to the company visible.
This already processed information is easy to analyse for a person prepared for this purpose, so that they will be able to make decisions based on the data collected and processed appropriately by our Business Intelligence application ARROWBI.
- We aggregate data from all systems into a single solution.
- Design of dashboards.
- Qualitative data analysis.
- Optimise your time.
